EthosCE Analytics Spotlight: New Data Visualization
As a CME director, it is likely that you’re awash in data sets—from learner assessment scores to student demographics to post-activity user feedback. You might have even devised a system for scraping insights from data sets wherever you can by making notes on patterns that you’ve seen over time. Notes, of course, aren’t the same as data visualization. A data visualization will provide you with a roadmap from information to insight—allowing you to skip the struggle to interpret patterns and jump ahead to troubleshooting and strategy building.
Data Visualization: The Easiest Way to Go from Statistics to Strategy
Perhaps your platform users performed better on assessments when you added multimedia elements to your curriculum last year, and you’ve discovered that a majority of your current students are visual learners. Or maybe your course completion rates are falling, and you’ve found that participants are not responding well to a change in the way a new activity is presented, based on your support calls.
If your LMS doesn’t include a robust analytics suite, capable of capturing data directly and making it simple to access, then you’re looking at an enormous amount of extra work to tag and prioritize each bit of new information to create a coherent picture of your program’s achievements. That workload will naturally increase as your program grows.
If you’ve switched to a CME management platform with enterprise-grade features such as EthosCE, then your data management concerns are over. The EthosCE LMS platform automatically collects, warehouses, and segments all of your course and learner data, providing you with a reservoir of error-free data that is always up-to-date and easy to access.

However, efficient data collection is only the first step towards optimizing the value of program data to inform your decision-making process. One of your biggest challenges as a CME director is making sure that you have all of the data that you need to create a solid foundation for long-term strategy-building. You need to know your students’ motivations, their learning styles, and the pain points within each activity that can dissuade weaker performers from staying through the end of the course. To accomplish this, you’ll need a simple way to get a quick overview of the patterns within your data and transform facts and figures into actionable insights.
How Data Visualization Streamlines Decision-Making
If you’re fortunate, then you’ve got the data that you need about your learners—their levels of engagement, knowledge retention, and overall satisfaction with their individual learning experiences—at your fingertips. You might even have a summary of the data that you need to start assessing how well your CME program is fulfilling its mission to improve your learners’ educational outcomes.
However, if you aren’t using an enterprise-grade LMS with a comprehensive analytics suite included, then it is likely that you’ll be missing several key data sets that will give your current metrics context and allow you to craft an effective long-term educational strategy. Here are just some of the data segments that you should have access to create an accurate portrait of your CME program’s overall performance:
Learner Behaviors
This data could include users’ interaction with your LMS platform over time at the aggregate and individual levels, segmented according to professional experience, familiarity with the LMS (new or returning students), and their educational goals (such as acquiring a new skill or enhancing professional competency).
Course Design Impact
This dataset would reveal any correlation between changes in curriculum, activity presentation, and learner assessment content and upticks (or downturns) in learner performance at the aggregate and individual learner level.
LMS Usability Impact
The quality of a learner’s user experience in navigating the LMS platform and completing activities has a direct impact on educational outcomes. User experience data would reveal how platform ease-of-use issues influenced student performance (such as students who experienced numerous technical issues with completing activities and later dropped out).
Without advanced data exploration capabilities, it is impossible to create a detailed portrait of your program’s strengths and weaknesses. You’ll also miss of the patterns above—such as a recurrent connection between LMS usability issues and learner outcomes—insights that you can only discover with an enterprise-grade LMS such as EthosCE.

Using the EthosCE Analytics suite, CME directors can:
- Create custom data sets and segments.
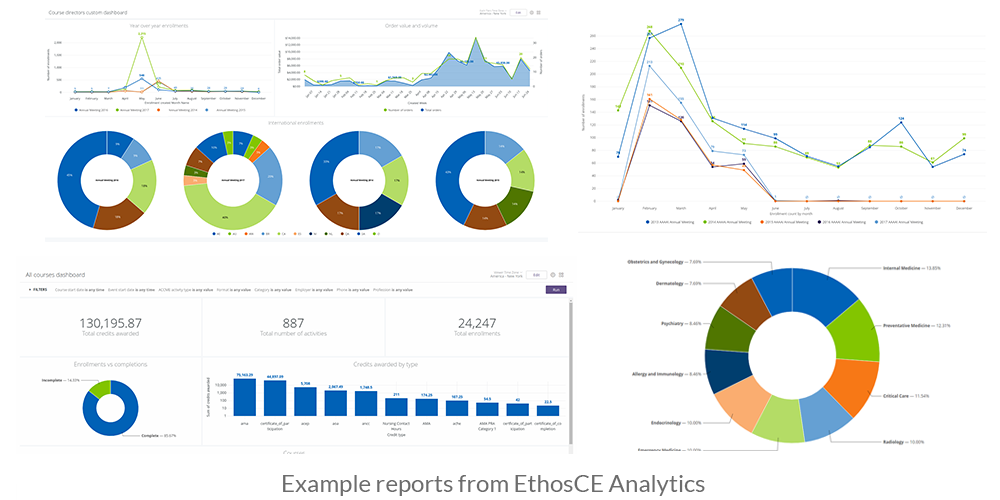
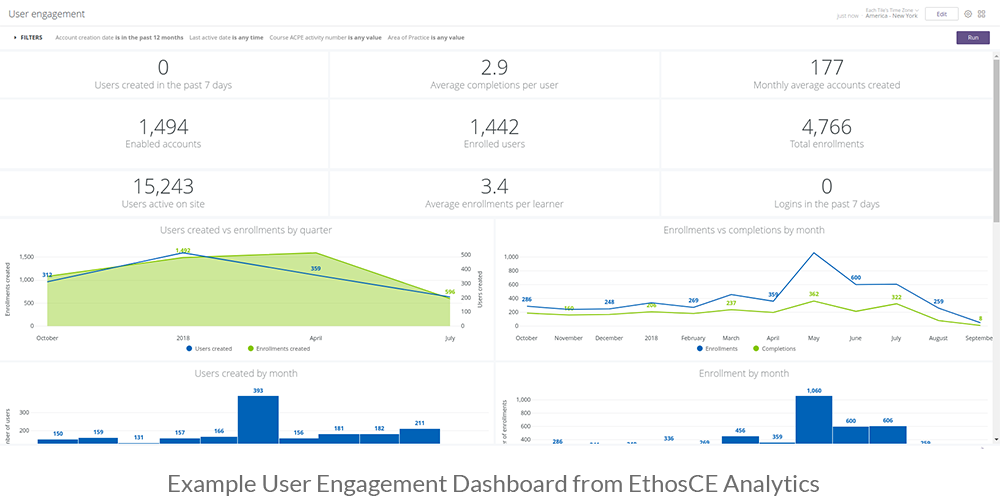
- Display insights on customizable dashboards that show real-time and historical information at a glance.
- Auto-generate and share data visualizations and reports presenting relationships between critical data over time, such as curriculum changes and learner performance.
With EthosCE, CME directors have a single source for insights and real-time LMS usage data. There’s no need to integrate multiple data collection platforms to view relevant learner behavior and course outcome patterns.
Using EthosCE Analytics, the analytics suite that comes bundled with the EthosCE LMS, you can look at new data in historical context in real-time. Whether it is a new activity module that new doctors struggle with or a topic that platform users insist is poorly explained, you can take disparate pieces of information and using data visualization to plot their meaning over time. That means that as you implement changes in your educational strategy, you will be able to see the impact on learner performance as it occurs, with a view to the effect of past decisions on aggregate learner performances.
Get the Most Out of Your Data and Get On With Your Work
The EthosCE Analytics suite gives you direct access to all of your critical data through a series of customizable dashboards that blends real-time and historical course and learner information into a single view. You can drill down to view comprehensive data on individual learners—even reviewing single responses in an assessment—and evaluate the course-wide impact of small changes in activity content. Best yet, you can generate visualizations of all of your insights with a click and share it across your organization.
EthosCE offers you an enterprise-grade solution for all of your CME management needs. From analytics to course management to helpdesk monitoring, EthosCE eliminates the need to hunt for new management solutions as your program scales. For more than 16 years, EthosCE has helped organizations for every size unlock the insights within their course data to create successful educational strategy. Connect with us to see what your data can do for you.
 We're now part of the Cadmium product suite! Learn more


